Swiss-based biopharma company Lonza will invest $46 million over five years in its Greenwood County plant, creating 30 new jobs, the state of South Carolina announced.
The company’s expansion includes nearly 50,000 square feet of new manufacturing space.
At the beginning of 2017, Agoria’s Ward Vleegen had a short time to make a big impact for his Belgian automotive group.
By mid-2018, he had.
As head of the newly created Transport and Mobility Group, Vleegen was charged with building a new division within the much larger AGORIA group – Belgium’s largest employer and trade association.
Ward Vleegen, head of Agoria’s Transport and Mobility Club in Belgium
Vleegen knew what he was doing – he’d been creating collaborations within the automotive industry for more than a decade. And his board and members were serious about building business – not simply joining another network.
The prospect of a U.S. trip was discussed almost from the time the group began in November of 2016.
Focused Approach
“My steering committee asked for a very focused approach, and not just a general visit,” Vleegen said.
About the same time, the Upstate SC Alliance, home to BMW’s largest manufacturing and plant as well as the North American headquarters of Michelin, asked SC Connect to help it make inroads into Belgium.
SC Connect reached out to Vleegen and his group. Cautious at first, Vleegen over time warmed to the idea and helped arrange a meeting with members of his group and the Upstate Alliance during the Alliance’s Belgian visit in June, 2017.
Once that happened, “We could see that the (Belgian) companies that were present were interested in South Carolina,” Vleegen said. “And that, for us, meant ‘okay, we have to move this forward.”
Driving Ahead
Through the summer of 2017, Vleegen, the Upstate SC Alliance, and SC Connect worked to connect the Transport and Mobility Club to the South Carolina automotive sector. The Belgian Consul General‘s office got involved, as well as the SC Department of Commerce and the SC Automotive Council.
As a result, Vleegen led a delegation of nine companies to the 2018 SC Automotive Summit, where they gave an afternoon presentation to some 500 attendees. SC Connect arranged meetings with key automotive industry players, including BMW, Sage Automotive, Draexlmaier and others.
The result: BMW has asked at least five of Vleegen’s members to connect with executives, and conversations with other partners continue.
“I think for me, personally, the meeting with BMW was really, really good. Because it gave insight that you cannot find on the internet—what are the technology needs of BMW,” he said.
Boots on the Ground
Vleegen knows he would have made the contacts within South Carolina sooner or later. But he credits SC Connect with speeding the process by making the personal connection.
“I think what is always essential is that we have a local partner to work with,” he said. “Working with someone like SC Connect, which has boots on the ground, was very useful.”
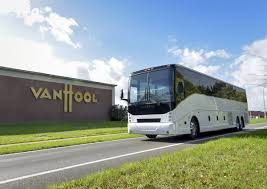
Belgian bus manufacturer Van Hool considered Orangeburg, SC, Fairfield County and Florence, SC as sites for the new plant recently announced for Morristown, TN.
But the company drove on due to concerns over supplying a future work force and difficulty finding the right site, the company’s in-house project consultant says.
Ultimately, Tennessee — a state not even on their original list — won the $47 million project, the company’s largest investment outside Belgium.
Tennessee Gov. Bill Haslam joined CEO Filip Van Hool April 12 to announce the project that’s expected to produce buses as early as 2021.
Project Consultant Benedicte Gruwez spoke recently at the US Embassy in Brussels, then later by telephone about the selection process for the 71-year-old company’s largest investment outside of Belgium.
Years of Planning
Van Hool began considering the US as a way to continue growing about five years ago, Gruwez said. With footholds in the private market, the company saw US growth through sales of public transport buses.
“We knew our US market. We knew that our growth was limited,” she said. “For us to grow, we needed to step into something that we were not part of yet.”
Having already sited a production facility in Macedonia, Van Hool knew the design and layout that they wanted for the new US facility. And, after attending the 2015 Select USA conference for foreign companies considering US investment, the company narrowed the search to the southeastern US – the East Coast because of its large population centers, the South because of its lower production costs.
Southeastern Opportunity
Soon, Gruwez was working with a list of five states – North Carolina, South Carolina, Florida, Virginia and Georgia.
“We have to find a place that we can produce the product and find people that can produce that quality we’re looking for,” Gruwez said. “Alabama, Tennessee and Kentucky were not initially in the first look.” But they were soon added, she said, because their experience with the automotive industry gave them skills, schooling and suppliers.
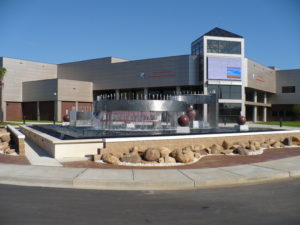
“That school just blew us away,’ she said. “The capabilities they had, the machines they had were amazing.”
Southeastern Institute of Manufacturing and Technology (SIMT) – Florence, SC
But the South Carolina sites didn’t fit Van Hool’s specifications, and the labor market seemed especially tough, Gruwez remembers, especially since the Volvo plant was opening only hours away near Charleston.
The final three states in contention were Alabama, Georgia and Tennessee.
Workforce is Destiny
In the end, she says, Tennessee “ticked all the boxes,” including right salary levels, proper site, mix of blue collar and engineering workers and general comfort level. South Carolina “fell out early,” she said, because of inappropriate sites and labor concerns.
“You need people from all ages- not only young people that just finished training” as SIMT in Florence could provide, Gruwez said. Not only was the company concerned that those newly trained at SIMT might disappear to Volvo, the company was also concerned that students still in school weren’t interested enough in manufacturing.
SC manufacturing executives told Van Hool that “people were not that much interested in manufacturing. Either they were going away or they were going into agriculture.”
The company’s big concern, she says, was “When we start up, will we find the 400-600 people we need from the beginning?”
“If you don’t have the people to do the job, it will be the problem.”
But examining the numbers behind the estimate illustrate the mystery that fuzzy statistics can really be, especially when it comes to calculating tourists. For instance,
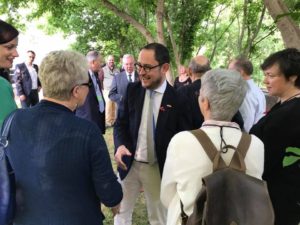
Vincent Van Quickenborne innocently raised the question during his trip to Greenville last summer. Van Quickenborne is the mayor of Kortrijk, a city in the West Flanders region of Belgium and Sister City to Greenville. He heard the number during an impressive presentation by Jennifer Stilwell of VisitGreenville.
With both cities having populations of around 70,000, Van Quickenborne was astounded that Greenville could log so many more visitors than his town.
Kortrijk Mayor Vincent Van Quickenborne during his trip to Greenville in June, 2017.
Van Quickenborne later asked SC Connect to help him understand how that number had been calculated. Van Quickenborne’s question led to the discovery of a House of Mirrors….with a hidden door… and a deep rabbit hole.
But with a little bit of legwork and a lot of their help, we came to understand this: The five million number is a tediously calculated, but very broad guess that can only be compared with other SC cities, not cities in other states or countries.
And in the end, it’s about as good a guess as anyone can get.
When is a visitor a Visitor?
As Jackson — the main estimator — told SC Connect about the five million visitor number:
“This is a ballpark number and doesn’t represent the number of visitors in 2016 or any one year. It is a ball park number of visitors for a given year in the recent past or present.” — Dudley Jackson, SC Parks, Recreation and Tourism Director of Research
SCPRT estimates 30 million visitors to South Carolina annually. That state-level number is statistically projected from a national survey which includes about 2,000 interviews with South Carolina visitors annually.
Importantly, those surveys use a very broad definition of “visitor.” It’s not just tourists or businessmen attending conventions like the recent SC Automotive Summit. A “visitor” is defined as anyone going to the region, including those
— making day trips,
— traveling through but not stopping in the city and
— staying with friends or relatives.
Bottom Line
The five million number is arrived at through legitimate means, but is in no way definitive. In addition, the number is only comparable to other cities in South Carolina, NOT cities outside the state (or country), since data collection and analysis will differ. So, the calculations giving Greenville more visitors than Orlando may each be valid — but they’re undoubtedly based on different assumptions.
So, want to know how the five million number is calculated? If so, read on…
Welcome to the House of Mirrors….
SC PRT for many years issued only one estimated number for the entire state. But a desire to use more localized numbers led SCPRT researcher Dudley Jackson a few years ago to develop his own approach. (SC Connect spoke directly to Jackson, and he is the source for the visitor estimates here.)
Today, the number issued for each county is actually a best guess based on three inputs, each the result of one of three different approaches to estimating visitors below:
Survey Data Supplied by TNS, a national research group. TNS surveys about 2,000 visitors to South Carolina annually. The total number of visitors to South Carolina annually has been around 30 million over the last several years, according to Jackson. The sample size for most individual counties is too small for estimates based on survey data alone.
Working Backwards from Accommodations Tax Collections. A 2% tax is charged to each hotel stay, which goes to the state for redistribution to communities to support tourism-related activities. Jackson uses that total per county to back into a number for hotel rooms sold, and then applies a multiplier to estimate total visitors.
Working Backwards from the number of rental units per county and occupancy rates.The number of units comes from a survey done annually by SC’s regional tourism offices. Occupancy rates come from a national research firm called STR. SC is also trying to get additional data from AirBnB.
With the three data points in hand, Jackson takes a three year average of each number, then averages that total number. He then rounds the number to get a reasonable guess that is then published. And, THAT is the five million visitor estimate that we see.
But we can tell you’re still curious.
To learn more about the three inputs, open that mysterious hidden door…
….Behind the Hidden Door…
Are you the type that just has to know the intricate details of calculation? Fine. Here’s Dudley Jackson of SCPRT to explain it all, edited for brevity and clarity:
In theory this idea is pretty simple, but in practice this is an extremely complex and labor intensive process.
To summarize the main idea, we take an average of multiple approaches to estimating visitation volume at the county level. That’s because when we need estimates for smaller and smaller geographical areas, even very large surveys often do not produce large enough sample sizes. There are also many other challenges for estimating visitation for counties towns and cities using survey data. Those include the possibility that visitors
–may not know where they are exactly, and
— may not remember day visits to towns as part of a trip to a primary vacation destination. (visiting Greenville on the way to Disney World, for example).
Our most recent estimate for annual visitor volume to Greenville County, produced in spring of 2017, was 5,000,000. This is a ballpark number and doesn’t represent the number of visitors in 2016 or any one year. It is a ball park number of visitors for a given year in the recent past or present.
This number would include visitors for leisure, business, visiting friends and relatives, medical travel, pass-through travel, evacuees from hurricanes and any other kind of travel you can imagine. It includes by day visitors and overnight visitors. We obtain our final estimate for each county by creating an in-house model that averages estimates from three different approaches, each of which have their own strengths and weaknesses:
Approach 1: The TravelsAmerica National Travel Survey by TNS
This is a survey of 35,000 United States households each month which asks them about their travel in the previous month. Two-thirds to three quarters of surveyed respondents will answer the survey and then two-thirds to three-quarters of those answering the survey will have taken a trip in the previous month. For a year, for the entire country this adds up to something in the neighborhood of 100,000 complete records each year and for South Carolina we usually get between 1,500 and 2,000 records of visitors that have taken a trip to the state in the whole year. (SC Connect emphasis). A few of our largest and most developed destinations, dominate the majority of those records. For many rural counties in South Carolina, they might get no records that report visiting them in a given year even though in reality they did get visitors. We take an average of three years of estimates to get an estimate from this approach and for counties with no sample or a small sample we basically ignore this number and just use the other two approaches
Approach 2: Work Backwards from State Level Accommodations Taxes Collected in Each County
Approach #2: A model which works backwards from state level accommodations taxes that are collected in each county
We know the amount of accommodations tax collections that are reported to our state department of revenue each year. We also know that it’s a 2% tax rate.
So, we take a three year average of collections and then we divide that mean by 2%. That gives us the corresponding amount of room revenue (sales) generated.
In order to continue working backwards towards a number of visitors, we have to have a large number of estimated multipliers. For this model, which is as close to mathematically correct as possible, we use the following multipliers:
— Estimated average daily “room” rate (3yr. avg),
— Percentage of room nights that are paid,
— Mean nights stayed by overnight visitors,
— Percentage of travel parties that are overnight, and
— Estimated household travel size.
The multipliers themselves are major source of potential error and if they are bad then your resulting estimates will be bad. (SC Connect emphasis)
We came up with a fairly complex process to use the STR (sales tax revenue) data for the room rate data and TNS data for the other multipliers. There are other ways to set this up and there are a lot(Jackson’s emphasis) of mathematical problems with no easy solution. These include
–How to figure out how many tax payers report their taxes properly,
— How to estimate daily rates for weekly vacation rentals as compared with hotels,
— How many people stay in each rental unit, and
— How to come up with multipliers for counties with a small TNS sample size.
I won’t go into how we resolved these but if you want more detail I can provide that later. We’ve done the best we can with it and tried to reality check it.
Approach 3: Work Backwards from an Estimate of the Number of Rental Units in Each County
Our agency includes our state parks service and state welcome center staff with about 400 total employees. The parks service takes up the overwhelming majority of those jobs but our welcome center staff is around 60 people and they are spread across our state at 9 welcome centers.
Each year the welcome center staff do a statewide ‘audit’ of all the various accommodations they can find in the state: hotels, rental homes, condos, campgrounds, etc. They look on the internet and in the phone book as well as in our existing records. They call these accommodations businesses and ask them how many rental units they have, among other questions.
From this process we have a database that allows us to estimate the number of rental units for each county. I think we probably capture about 90% of them.
For this model, which again, is as close to mathematically correct as possible, we use the following multipliers:
— Estimated occupancy rate (3yr. avg),
— Percentage of room nights that are paid,
— Mean nights stayed by overnight visitors,
— Percentage of travel parties that are overnight, and
— Estimated household travel size.
— All of the same issues and disclaimers from model number two above apply to this approach.
Let’s just pause here for a minute, stand up and give appreciation to
Dudley Jackson, SCPRT director of research, statistician and eager student of estimated household travel size.
The five million figure for Greenville may be a ballpark figure, as Jackson says, but at least we know the GPS coordinate of the ballpark, thanks to his collating of various information sources.
Ok. Now that you’ve had a chance to stretch your legs, let’s continue…
….Into the Rabbit Hole…
(Jackson continues his explanation)
For Greenville County from approach #1, our estimate was about 2.5 million.
That number is itself an average of three years (2.3M, 2.7M and 2.5M). This seems a long way from five million so let me explain why.
In the TNS data, respondents can indicate where they went in the survey by choosing destinations from a drop down menu or by tying them in. Again fortunately we purchase the record level data and so for the destinations that are typed in, we assign them to a county.
However, unfortunately TNS populate the drop down menu with the choice “Greenville/Spartanburg”. As you can imagine this creates all kinds of confusion so we had to find a way to separate out which of those visitors went to Greenville and which went to Spartanburg counties.
Most of the destinations in the drop down menu have a similar problem. In any case, the starting number for Greenville/Spartanburg for the three years was 3.8M, 3.5M and 3.6M. I won’t go into the process, but we wound up allocating about 20-30% of those each year to Spartanburg County.
For Greenville County from approach #2, our estimate was 5.7 million.
We found that for many counties the estimates from the two models were larger than the estimate from the survey data but Greenville was one of only a couple where there was an enormous difference. I would expect the two models to yield larger numbers considering that survey respondents often don’t remember all their travel and either can’t or don’t report all their travel on a questionnaire.
For Greenville County from approach #3, our estimate was 6.8 million.
For both this approach (#3) and approach #2 above, Greenville is an outlier among the developed counties for having a short length of stay due to all the business travel, a high incidence of visiting friends and relatives due to the large population and a lot of day visitors. In the TNS survey data, business travel, trips to visit friends and relatives and day visitation are all going to be very under-represented due to the way the questionnaire is set up. So Greenville is a little bit of a problem child but for many counties the three estimates are relatively close together. Based on a lot of the checks we have in place I’m pretty sure our model is generating decent estimates.
If you’re wondering whatever happened to Mayor Van Quickenborne and the original question….
Van Quickenborne brought his town’s tourism official into the conversation — Gauthier Renard — and continued to press Jackson for more information.
A Belgian news article from the summer had listed Kortrijk as having just over 232,000 room nights the prior year, and Van Quickenborne asked and received Jackson’s guess for the number of room nights in Greenville — again, a squishy number.
Jackson’s answer — around 1 million.
“Now, it is clear,” Van Quickenborne wrote to his tourism official. “We have to quadruple our number. Gauthier, this is our challenge.”
Belgium is less than half the size of South Carolina.
In March, the annual SC Automotive Summit featured first-ever presentations by a foreign delegation, from 10 members of the Belgian automobile sector. While not the industrial powerhouse of neighbors France, Germany and The Netherlands, Belgium still ranks in the top 20 nations for competitiveness — not bad for a country less than half the size of South Carolina.
The visiting Belgians are part of the Transport and Mobility Group of Agoria. With more than 1,700 members, Agoria is Belgium’s largest employers’ organization and trade association. Ward Vleegen, head of the visiting sector group, presented three big ideas worth remembering:
Focus on Productivity
Belgian labor costs are 50% higher than the US, and are exceeded only by Denmark and Norway in the 28-member European Union. They’re nearly twice as high as 15 of the EU countries and are the highest of all European auto-producing nations. The consequences of such high labor costs have been gut-wrenching at times, as with the 2014 closing of Ford’s plant in Genk, which at one time employed 4,300 people.
Ward Vleegen, Head of Belgium’s Transport and Mobility Club at Agoria
Vleegen asked the Auto Summit crowd how SC would compete if it faced competition among states as Belgium does among countries. Spain’s labor costs are 45% less than Belgium’s—comparable to Wisconsin’s; and Poland’s are 90% less – comparable to New Mexico, Vleegen said.
Belgian Startups Focus on Business-to-Business Opportunity
According to Vleegen, 92% of Belgian startups focus on the B2B sector, compared to 61% in Europe as a whole. “That means we have a very business-oriented startup community,” he says. And Manufacturing is the second-most targeted sector for Belgian startups, behind Health Care. In Europe overall, Manufacturing ranks as the 6th most-targeted sector.
Vleegen’s analysis? This shows that Belgium is “a breeding area for innovations in manufacturing.”
According to the SC Manufacturer’s Alliance, manufacturing accounts for 12% of the state’s workforce and 20% of its GDP. Moreover, South Carolina’s average manufacturing wage has risen about 30% faster than the national average since 2007, according to the U.S. Bureau of Labor Statistics. Making that industry more productive and competitive could have a big positive impact on South Carolina.
And — counterintuitively — more efficient manufacturers don’t necessarily mean less manufacturing jobs.
Efficient Manufacturers Create Jobs
Since 2015, Agoria and Sirris — a Belgian technology collaborative — have sponsored a “Factories of the Future” award based on their “Made Different” manufacturing transition plan. The honor is presented to companies which — according to Agoria — “excel in how they handle energy and materials”, and which have “creative, involved workers use smart, sustainable production processes in state-of-the-art facilities. The result: an agile, future-proof business that manufactures products with high added value.”
The trade association has tracked these innovative and efficient companies and found that they’re actually increasing the number of jobs. While employment overall in the sector fell about 5% since 2012, the 16 companies winning the “Factories of the Future” award saw an 11% increase in employees.
The result, says Vleegen, is that Belgium is showing that human-centered, efficient production is viable and sustainable.
Agoria, Belgium‘s largest employers’ organization and trade association, provides services for its members on international business development and specialized technology solutions which focus on enhancing business opportunities for its members.
The Transport and Mobility Technology Club was founded in the fall of 2016 and is the newest of eight active manufacturing sectors represented within Agoria. Despite its youth, the club already has nearly three dozen member companies.
Agoria means progress through technology, and the organization paves the way for all technologically-inspired companies in Belgium that strive for progress in the world through the development or application of innovations.
Agoria is proud that more than 1,800 member companies, who together represent around 300,000 employees, put their trust in the three pillars of our services: consultancy, business development and the creation of an optimal business climate.
About the speaker: Ward Vleegen holds a Master’s Degree in Industrial Engineering and joined Agoria in 2015, where he is in charge of the Agoria Transport & Mobility Technology Club. Ward has held different positions in the automotive industry for more than 20 years, including engineering, project management, account management and consultancy. https://www.linkedin.com/in/wardvleegen/
AMS Belgium is a young, global and dynamic full-service provider of automation projects using robots & PLC systems. AMS offers turnkey automation solutions for manufacturing industries, and has extensive experience with the automotive and food industry. Customers include BMW, Volvo, Daimler, Volkswagen, Tata and Ford.
Its new Robomoulding division molds plastics using rotational robots, opening potential new markets. Since a furnace is not used in the molding, up to 95 percent of traditional energy used in production is saved.
A Global Presence
The company has offices in Belgium, the Netherlands, South Africa, Germany, Romania, India and Italy, as well as partnerships with main line builders in Austria, Brazil, Mexico and the USA.
AMS has nearly 400 installed robots, as well as about 50 employees around the world – a number it expects to double by 2021.
Family Business
Founder Johan Potargent and his son, Laurens, run the company from their office in Bilzen, near Brussels. Johan says the two fundamental themes running through all of his projects are safety and superior quality.
The company has seen good growth throughout the world, and expects to continue growing its robotics and molding businesses, to be followed by software and consultancy.
About the Speaker: Johan founded AMS Belgium in 2006, after several management functions in different automotive companies. Johan carries a Bachelor’s Degree in Engineering and an MBA in International Marketing Management. https://www.linkedin.com/in/johan-potargent-754a302/
The Burke Porter Group is a global leader in the design, manufacture, and supply of advanced technological testing and assembly solutions. The company encompasses 31 locations across four continents, with manufacturing and support capabilities across the globe. Leading experts for more than 60 years, BEP is passionate about delivering the best products and the greatest customer experiences.
Started in Grand Rapids, Michigan, Burke Porter began producing high-quality, high-durability machinery in 1953. By 1994, the company had developed the first, modern roll and brake testing machine, which integrated AC motor technology and replaced older hydraulic machinery methods.
“… BEP Europe (BEPE) works together with other companies within the group to build intelligent machines for automotive, life science and advanced manufacturing markets. Until 2009, BEPE focused exclusively on end-of-line test installations for automotive assembly plants, with some of its biggest customers including PSA and the VW Group.
“Today our position in the market is a far more diverse one, although end-of-line tests still remain our main revenue generator,” begins Ward Van de Walle, Chief Technology Officer at Burke Porter Group. “Alongside BEP Europe’s original customers, the larger group now works with the likes of BMW, Mercedes, Fiat and JLR, offering full vehicle end-of-line testing, axle testing and component testing.”
In addition to its automotive test installations, BEP Europe is skilled in the development of new machine technology. The majority of its R&D work in recent years was based on the Organic Rankine Cycle – converting waste heat into electricity – with these machines commercialised under the brand name, E-Rational as part of its constantly developing portfolio.
Organic growth
The post continues:
“…Burke Porter Group (BPG) focuses its energy on both organic growth and growth through company acquisitions. The past two years has seen the acquisition of six companies, including Universal Balancing, CIMAT, Epic Equipiment, Kleinknecht, Korvis and Lismar, all of which have brought new product lines and technologies to the company.
“For our automotive business line, we have invested in new product development with a main focus on autonomous driving, the electrification of powertrain in cars and NVH testing,” explains Van de Walle. “There are vast amounts of disruptions today that are driven solely by technology and that is a factor that we are attempting to tackle in our work.”
About the Speaker: After working for Chevron for 4 years, Ward Van de Walle joined BEP Europe in 2002. He has had different roles in the company, such as engineering manager, managing director energy and infrastructure and currently VP New Business Development & CTO of the Burke Porter Group. Ward has a Master’s Degree in Materials Engineering and an MBA. https://www.linkedin.com/in/ward-van-de-walle-7b7b031/
Ward Van de Walle – VP, New Business Development & CTO
E-mail: [email protected] Tel: +32 50 40 85 65 / Cell: +32 486 43 77 20 BEP Europe, NV Ten Briele 6
B-8200 Sint-Michiels (Brugge), Belgium
Website: www.bepco.com
conTeyor is a leader in the innovative niche market of B2B re-usable packaging solutions.
Plastic bags, cardboard, bubble foil and the like are made obsolete. conTeyor offers solutions that eliminate the need for expendable, single-use packaging materials by tailored designed solutions.
Increase Efficiency and Profitability
conTeyor focuses on parts protection and lean manufacturing. Their customized packaging solutions allow companies to increase efficiency and profitability. Their goal is to eliminate all waste packaging and to increase the component ‘s load factor in a container or box, thereby reducing transport costs. Special attention is given to the ergonomics and weight of the final solution. conTeyor considers its job well done only when the operator likes to work with the conTeyor solutions. conTeyor has specific expertise and experience in various sectors of industrial assembly, meaning both the automotive as well as the non-automotive industry.
conTeyor offers customers better protection for their components, a higher packing density, re-use of packaging material, and easier & more ergonomic handling. This allows them to cut costs and lower their carbon footprint at the same time.
About the Speaker: Jos van Bree founded conTeyor International in 1995. He is a self-made man who started his professional career at the assembly line of VOLVO in Ghent Belgium. He was working for Volvo cars, Volvo Trucks and Volvo parts division. The link in his career is the passion to improve processes, products and performance. https://www.linkedin.com/in/conteyor-jos-van-bree-01726b54/
Troy A. Saunby – Commercial Director, North America conTeyor US
E-Mail: [email protected]
Tel: +1 248 439 6487 / Cell +1 248 228 0263
conTeyor US, 750E
Mandoline Avenue, Madison Heights, MI 48071
James Guy – Customer Solutions Manager
E-Mail: [email protected]
Cell: +1 (980) 875-0077
conTeyor US, 750E
Mandoline Avenue, Madison Heights, MI 48071
Facil transforms the low-cost, high complexity world of fasteners into a full-service support system that standardizes parts, streamlines re-supply and cuts time and labor costs. OEM customers such as Daimler and Volvo use Facil from the early concept and design phase throughout the product’s entire lifecycle.
Facil calls its employees “Fasteneers”, and coordinates 400 Fasteneers in 17 sites around the world from its headquarters in Genk, Belgium. The group has its North American headquarters in Twinsburg, Ohio, as well as a distribution center in Charlotte.
Pieter Houben, vice president of marketing, says Facil’s chief differentiator today remains what it has always been: a cemented set of morals filtered down from a mother company partnership steeped in family values and entrepreneurial flair.
“We have to be the most innovative in the world of fasteners,” Houben says.
The companies created Facil, which works from initial part design to material sourcing to delivery, lowering costs and adding value. In short, Facil works to eliminate duplicative parts in system, then sources the parts to OEMs and others.
In South Carolina, Houben will be looking to build relationships with OEMs and looking to meet with advanced material companies. In the end, he sees the trip to the SC Automotive Summit as a way to extend and build relationships.
Facil, he says, would rather have 50 long-term partners than 1,000 customers.
About the Speaker: Pieter joined Facil in early 2015. Prior to that, he worked at Agfa Gevaert where he held various positions mainly in Supply Chain. Pieter carries a Master’s Degree in Industrial Engineering and an Executive MBA. https://www.linkedin.com/in/pieter-houben-587718/


 Swiss-based biopharma company Lonza will invest $46 million over five years in its Greenwood County plant, creating 30 new jobs, the state of South Carolina announced.


 Our agency includes our state parks service and state welcome center staff with about 400 total employees. The parks service takes up the overwhelming majority of those jobs but our welcome center staff is around 60 people and they are spread across our state at 9 welcome centers.


 Troy A. Saunby – Commercial Director, North America conTeyor US
 James Guy – Customer Solutions Manager